Wednesday, March 28, 2012

Risks in Oil Business


I just read the financials of Basic Energy Corporation a couple of days ago and I was quite curious in the inherent risks that oil companies face in this business (I am talking about drilling wells, exploration, etc and not oil stations we normally see in our places.)

Oil+Drilling+Platform+in+the+Santa+Barbara+CA+Channel
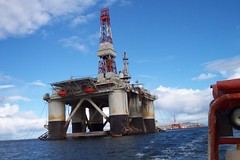
http://www.flickr.com/photos/94299816@N00/5848576484
Drilling oil is a risky business. Even if you find an oil deposit, it will not guarantee you that it can be commercially extracted. Also, the cost of exploration and drilling will cost you a fortune. That is why most of the companies bidding for oil exploration contracts from the government normally forms a joint venture to lessen the burden of the drilling costs. Aside from that, oil companies will normally invite a foreign investor to pay for all the drilling costs in exchange for a certain percentage of the oil profits if it is commercially viable.

However, if you find a gusher, an area rich with oil, it can top up the cost you have incurred in the previous drilling. 

I would like to share this to everyone which can also be access in www2.pse.com.ph.

Here you go.

In the Oil and Gas and Geothermal Operations, the Company is faced with the following risks, in order of importance:

(a) Probability of Exploration and Development Success.  Oil and gas exploration and geothermal projects are inherently high-risk undertakings. There can be no assurance that the Company's activities will be successful in discovering commercially viable oil and gas reservoirs and/or a viable geothermal resource.  Even if an apparently feasible resource is determined, there is no guarantee that it  can be  economically exploited.  Despite the Company's reliance on advanced technology such as 3-D seismic data to improve the probability of success of discovery, oil and gas exploration and geothermal is still a speculative business.  Advanced technology, even with the correct interpretation, only assist geologists in identifying subsurface structures and does not ensure the certainty of the presence of hydrocarbons if drilled.  Moreover, 3-D seismic data and other advanced technology require higher investments that may result in higher losses, should the drilling prove unsuccessful. 

Risk of heavy financial losses if prospects would prove unsuccessful could be mitigated through:

Farm-Out of Interest.  A  Farm-Out Agreement  is  a  contract  whereby  a third party  agrees to acquire  from  a  licensee an interest in  a  production license and the corresponding operating agreement for a consideration normally comprising of an undertaking to perform a specified work obligation in the drilling of one or more wells.  Farming out is usually undertaken by the seller of interest as a source for funding or as part of the rationalization of a licensee's interests.  The seller may want to dispose of areas or interests which are peripheral to its main operations or in which it has small equity holdings but would take up as much management time as a larger holding.

Spreading Exploration Risks through Joint  Ventures in Several Exploration Blocks.  Forming alliances and jointly  bidding for the development of  a range  of  opportunities in  oil  and gas exploration and geothermal projects, mitigates exploration risks of a corporation as there is risk- sharing - the  cost and responsibilities of  drilling and production are spread over  a  number of entities.  Joint ventures also enable companies to free up firms otherwise tied up in a single drilling project and enable these companies to build a portfolio of prospects.

Exploring in Geological Proven Petroleum Areas.  The Company has been making investments and will continue to invest in geologically proven petroleum provinces only.

(b)  Operating Hazard of Exploratory Drilling -4ctivities and Environmental Risk. Drilling operations may be delayed, curtailed or subjected to operating and technical difficulties. Unexpected drilling conditions, adverse weather conditions, unanticipated pressure or formations, equipment breakdowns, industrial and  environmental accidents and other such events may occur which may have adverse effects on the Company's operations and correspondingly on its financial performance and condition. Oil and gas and geothermal exploration and drilling activities will be subject to Philippine environmental laws and regulations. Normal  exploration and  drilling operations  involve  certain operating hazards  such  as explosions, crate rings, well blowouts, uncontrollable flows of oil, natural gas or well fluids, releases of toxic gas, accidental leakages, formations with abnormal pressures, fires, pollution and other environmental perils and risks, any of which may subject the Company to extensive liability or loss of assets.

Operating risks in the exploration and development drilling and production phases are generally directly driven by standards in design, procurement and installation, operating procedures and contingency planning.  The Company, in its investment evaluation process, considers the presence and implementation of the following measures and strategies to mitigate risk exposures: (i) hiring  of technically competent staff that are  adept in  utilizing state-of-the-art technology and  could conduct effective evaluation work; and (ii) ensuring adherence to the various environmental laws and regulations, taking into account not only local but international expectations as well.

(c) Volatility of Oil and Gas Prices and Exchange Rate Risks.  Revenues derived from successful exploration and drilling activities depend on the world price of oil. The price of oil is sensitive to minor  changes  in  the  global supply  and  demand  conditions, quality  of  oil,  forward  selling activities, domestic and foreign government regulations, environmental trends, overall global economic condition and other macroeconomic and political factors that are beyond the Company's control. Furthermore, revenues from drilling activities are pegged to the US dollar; hence, the Company is exposed to exchange rate risks given the volatility of the rate of exchange between the U S dollar and Philippine peso.
Oil+Drilling+Platform+in+the+Santa+Barbara+CA+Channel
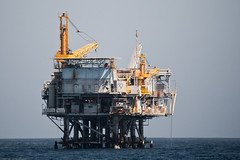
http://www.flickr.com/photos/72825507@N00/3898808431

(d) Government Regulations and Approvals.  Government action such as changes in regulations may affect the Company's business and eventual operating and financial performance. Government may limit access to prospective development areas, implement stricter environmental laws to protect human health and the environment, impose higher taxes and royalties, all of which may adversely affect the Company's financial performance. For the risks mentioned in items (c) and (d) above, these risks could be mitigated through early identification systems of  risk  exposures  to  external  threats such  as  changes  in  government regulations and changes in the geo-political environment of operating locations. The Company will also continue to negotiate oil price agreements with inputs from experts.  The Company,  as  a member of a consortium, adheres to its policy of involving competent technical professionals in the preparation and negotiations of oil price agreements.  The Company will also continue to involve competent technical professionals in the preparation and negotiations of power purchase agreements for its geothermal projects.


Saturday, March 17, 2012

What is Simple Moving Average (SMA)?

What is Simple Moving Average (SMA) ? Well, the basic definition of SMA is that it is the average price of the past 30 days. Yes that's it.

For example, CEI price for the past 30 days are the following:


The total of the price is 2.399, divide it by 29 and that will be your SMA. Take a look at the chart below and focus on the blue color that I encircled. The blue circle is at the .083 price. Our quotient in the above is .083 also. So, they are matching and our SMA in the chart means it is correct. By the way, COL is using 32 days in the chart below.

Now, if tomorrow the closing price is .096, then we will add that .096 in the 30 days and then we will remove the last price of the previous day. See below. The last price is remove and the price tomorrow is added. See below.

The rule is that SMA reflects the price of the stock for the last 30 days. As the days move on, the days in the previous days are removed and the current ones added.

The good thing about the charts is that we do not have to compute the SMA manually. The internet has provided all the tools that makes all calculation simple. Take advantage of it. In the chart above, the SMA is being computed automatically and you dont have anything to do except to analyze the chart.

We can use the SMA to determine the trend of the stock. In the chart above, the trend is going up. If the price goes below .083 tomorrow, then it's a sell signal. You need to be alert in your stock because anytime it can go down further. Why? Well, because the average price for the last 30 days is .083 and if the stock goes below the average price, we need to be wary. Perhaps, people are dumping their shares now and are starting to get out of the stock.


Thursday, March 15, 2012

Selling A Stock: Distribution Days

Buying a stock using technical analysis may perhaps the easier one to spot than recognizing when to sell. Selling a stock is equally important as buying a stock. We should know when to buy and when to sell. While there is no exact science when to sell a stock or buy a stock, we might as well consider some useful analysis that will help us in determining when to sell or buy a stock.


Technical Analysis (TA) are not 100% infallible. They are infallible but they do assist us to be prepared in our trading plan.


I've read a handful of articles about when to buy a stock and I must admit that they helped me a lot when to buy a stock. Now, the second thing we need to know is when to sell a stock.


So when is the time to sell a stock?


One indicator is called distribution day.


Distribution day means giving and when you give, you take away something from you. And when something is taken from you, you are distributing your wealth. Talk about charity.


In stock market, we also have what we call distribution days.


Distribution day in the stock market means that the stock went lower with a volume greater than the previous day. That's it. 


The key is that the stock is lower than the previous day and the volume is greater than the previous day also. Alternatively, the volume is greater than the average volume of the past three weeks.


Below is an excerpt from MarketWatch.

Marder: "You are a believer in watching for distribution days in the averages, indicating professional selling, to determine whether a market is topping. Is there a particular number of distribution days you use to tell you whether the market is beginning to get into trouble?"

O'Neil: "The number of distribution days that signals a probable top has changed over the years. This is due to the markets being so much larger than before. Institutions are managing a lot more money these days.
"It used to be that three, four, or five distribution days would occur before a top was signaled. Nowadays, it can be up to six distribution days. What most investors don't realize is that a market will undergo distribution as it is advancing.
"Following an advance in the averages, I would ignore the first two days of distribution, but I would begin to get concerned on the third distribution day. On the fourth distribution day I would begin to sell some of my positions. On the fifth day, I would sell more, and on the sixth day I would sell more. The distribution day concept does not say how far down the market will go or how long the decline will last. It could be two days, two months, or two years. It is supply and demand that determines prices and how far a decline might go."
http://www.marketwatch.com/story/how-to-recognize-a-market-top-2012-03-08 
 

There are numerous opposition to the distribution day. Thomas Bulkowski made his own research about this and the results doesn't fully support that distribution days really worked. See below link.


Personally, it does help to recognize the volume when the stock price is in red. You consider the fact that mutual funds, investment bankers, institutional investors are perhaps moving away from the stock. It's a signal that is useful especially when volume is quite big as compared to previous days. I would treat that downwards is perhaps in the horizon.


http://www.marketwatch.com/story/how-to-recognize-a-market-top-2012-03-08 
http://www.stocktradingtogo.com/2007/05/08/distribution-days-explained/ 
http://www.thepatternsite.com/DistributionDay.html 

Century Property Group (CPG)

I was supposed to do dig some info about CPG when I saw the charts the other day. Last Tuesday, it went up to 1.80 and I thought I will be left behind. Today, the price is 1.69 and is just a notch lower than my buying price of 1.68.

Let’s take a look about the general info of CPG.

GENERAL INFO
Century Properties Group, Inc. (CPG), formerly East Asia Power Resources Corporation, was incorporated on March 23, 1975 as Northwest Holdings and Resources Corporation. In September 26, 2011, the Board of CPG approved the change in the Company's corporate name to its present name, as well as the change in its primary business purpose from power generation to that of a holding company and real estate business.

Century Properties Inc. (CPT) is the parent company of CPG. On September 2011, the Board of CPI approved the subscription of shares of CPI's subsidiaries to CPG in order for CPG to be engaged in the real estate industry.

The Company undertakes real estate projects and developments through its subsidiaries, namely: 1) Century Communities Corporation; 2) Century Properties Management, Inc.; 3) Century City Development Corporation; and 4) Century Limitless Corporation. CPG has built over 22 buildings and 720 homes, with a 100% completion rate of all its projects. CPG currently has four projects under development including Century City in Makati; Azure Urban Residences in Paranaque City; Aqua Residences in Mandaluyong City and Canyon Ranch in Cavite.
Source:www2pse.com.ph

PERSONAL CALCULATION
Earnings per share (EPS): As of Oct 2011, EPS is .202 . Averaging for the year 2011, EPS would be .24.
Price/Earnings Ratio: Price ÷ EPS
Price/Earnings Ratio: 1.7 ÷ .24 = 7.19 times.
If everything else equal, it is a good buy considering the fact they expect sales to top at 20 billion sales in year 2012.

CITISECONLINE'S RESEARCH
Coincidentally, Citiseconline published its research about CPG last Tuesday, thus it lessen my burden of digging further and I just compare my notes against them.
According to Citiseconline, Century Properties is targeting a net income of Php2 Bil this year to be driven by higher sales and project completions. At the current price of Php1.69, CPG shares are trading at 7.56X FY12E P/E. This is lower than the industry average of 13.82X. Taking out ALI, which traditionally trades at a premium to other developers, the industry average is 9.92X, which is still higher than CPG’s current valuation.

I would like to note that most of CPG's properties are high-end type and more than 50% of their clients are overseas based.
LATEST NEWS
Century Properties collaborates with MissoniHome
The fun and colorful design aesthetic of Italian knitwear brand Missoni will now be replicated in the 52-storey Acqua Livingstone residential building being developed by Century Properties Group Inc.
This is the first condominium designed by MissoniHome in the world.

Century Properties eyes hotel development
Century Properties Group (CPG) is considering venturing into hotel development as it seeks to further expand its revenue stream.

CPG managing director Marco Antonio said the company is studying the possibility of diversifying into other segments of the market to build up its recurring income portfolio.
“We hope to grow recurring income base to more than 10 percent of the portfolio. With opportunities in the pending real estate investment trust law, it may serve as an impetus for us to create a recurring income stream,” Antonio said.

Century Properties eyes OFWs, Chinese, Singaporeans for Acqua Livingstone
Century Properties Group Inc. is building a 52-story development along Pasig River designed by Italian Missoni Home for P3.5 billion, the company said in a press conference over the weekend.

Called Acqua Livingstone, the development with a view of the Makati and Taguig skylines will be marketed mostly to overseas Filipino workers and foreigners.

“It is the first residential building in the world that will bear the creative and colorful mark of Missoni Home,” said Marco Antonio, Century Properties’ project head and managing director. “It is not available elsewhere, except in Missoni-branded
hotels in Edinburgh, Scotland and Kuwait,” he noted.

CPGI and parent Century Properties sell shares to Netherlands-based APG
Century Properties Group Inc. (CPGI) and parent Century Properties Inc. (CPI) are selling 868, 316,042 CPGI shares to Netherlands-based APG Strategic Real Estate Pool N.V., CPGI said in a statement Tuesday to the Philippine Stock Exchange.
CPI is the seller of the shares in the deal.

In January 2011, CPI issued convertible bonds to APG, but APG decided to enter into a purchase agreement for CPI to buy the convertible bonds from APG.

TECHNICAL ANALYSIS


The main reason why i checked CPG's info is because of it's technical data. Looking at the chart, the trendline touches at four points which is a good indication that buying at 1.68 is a good call as long as 1.68 doesn't break. Past few days volume has increased also igniting some interest from investors as well as traders.

Whenever CPG touches the 1.8 price it is always going down thus that price serves as its resistance.
 

Monday, March 12, 2012

What is Ten Ticks?

I was reading the book “Getting Started with Technical Analysis” when all of a sudden I came across the word “ten ticks”. I was baffled what this ten ticks is all about. I thought about it as a 10%  profit or loss. Sometimes reading books with technical terms will make you dizzy. I thought of just putting the book at my little book shelf and focus on other things that I may understand. Besides, I still have some things to do other than thinking about its meaning. Perhaps next time I read it, it will be clearer.
Well, when I read the book, obviously I needed to learn some of the terms associated with technical analysis. It is difficult at the beginning but through constant practice and reading it again, I was able to muster the shallowest meaning of it. I read the first chapter and I got dizzy so I rested for a while. Then I reread again the first chapter, the meaning became clearer. But after learning the meaning of it, I am tempted to move on to the next topic since I know something about it already. But since I want to fully understand what the first chapter is all about, I read it again. This time all the terms and words contained in the first chapter were clear to me. Clear as mud. The charts presented also makes sense now. I view the charts before as some kind of a drawing plotted by a frustrated architect.

TIME+FLIES.....................%2A
http://www.flickr.com/photos/10175246@N08/4214164660

Anyway, moving on I just searched the terms of the words in Google and most especially this ten ticks words. My interpretation is that this tick applies to the broader market. It is an indicator on the trend of the total stocks being traded in the stock market. As far as individual stocks are concerned, it doesn’t affect your decision especially in the Philippines stock market. In essence, it doesn’t apply to me personally.
On the other hand, I personally opined that ticks can be viewed as fluctuations. For example, PLDT’s price today is 2,758 pesos. PLDT’s fluctuation is 2 pesos. So, if you are going to buy PLDT, you cannot buy 2757 or 2755. You can only buy at 2758, 2756,2754, 2752 and so on and so forth.
Another example is CEI. Today’s price is .088 and the fluctuation is .001. Thus, if you are going to buy, you can buy at .088,.087,.086 and so on and so forth. You cannot buy at .0865 or .0875 because the fluctuation is only .001.

Recommended readings:


Sunday, March 11, 2012

Internal Trend Line


Yung una po nating chart sa nakaraang blog ay tinatawag na conventional trend line. Pagdugtungin mo lamang ang dalawang pinakamababang presyo, iyon na ang iyong conventional trend line. Tingnan po natin ang conventional chart sa ibaba.


Ang internal trend line naman po ay ang pagdudugtong ng mga mababang presyo ng higit pa sa dalawa at may linagpasang presyo (see 1,2,3,4 in the chart below). Kadalasan, nakakatulong po ang internal trend line upang makapagdesisyon kung bibili o magbebenta ng stocks.

Kapag yung presyo malapit na sa trend line (see # 3 below, hudyat na po yan na pwede na tayong bumili. 

Lagi po nating tatandaan na ang mga chart na ito ay hindi perpekto at maaaring mag-iba ang direksyon ng trend. Kapag nagiba ang direksyon, ibig sabihin po, sell signal na (see below chart with biggest circle).

Yung biggest circle sa chart natin sa baba, parang sumilip lamang po siya sa mga nakaabang sa baba dahil bigla po itong tumaas.

Recommended Reading: Getting Started with Technical Analysis by Jack Schwager


Saturday, March 10, 2012

Trendline - UpTrend

Perhaps you've been seeing a lot of graphs that doesn't make sense to you. We'll let's take a look on what a trendline is.

See the chart below. The long red line is called the trendline. Just draw the line from the lowest point to the next lowest point. 


Just keep on plotting the two lowest point and you will master the trendline. Then, compare it against the trendline of your stockbroker if it is correct.

Just keep on plotting. Notice that there are no prices that go beyond the trendline. Practice makes perfect.

Obviously, what I have illustrated above doesn't capture the essence of technical analysis, but at least we won't be rattled when we see a trendline.

Recommended readings:
http://stockcharts.com/school/doku.php?id=chart_school:chart_analysis:trend_lines
http://daytrading.about.com/od/trendlines/ss/DrawTrendLineUp.htm